Configuration of the Bubble Chart
Can the bubble chart be configured?
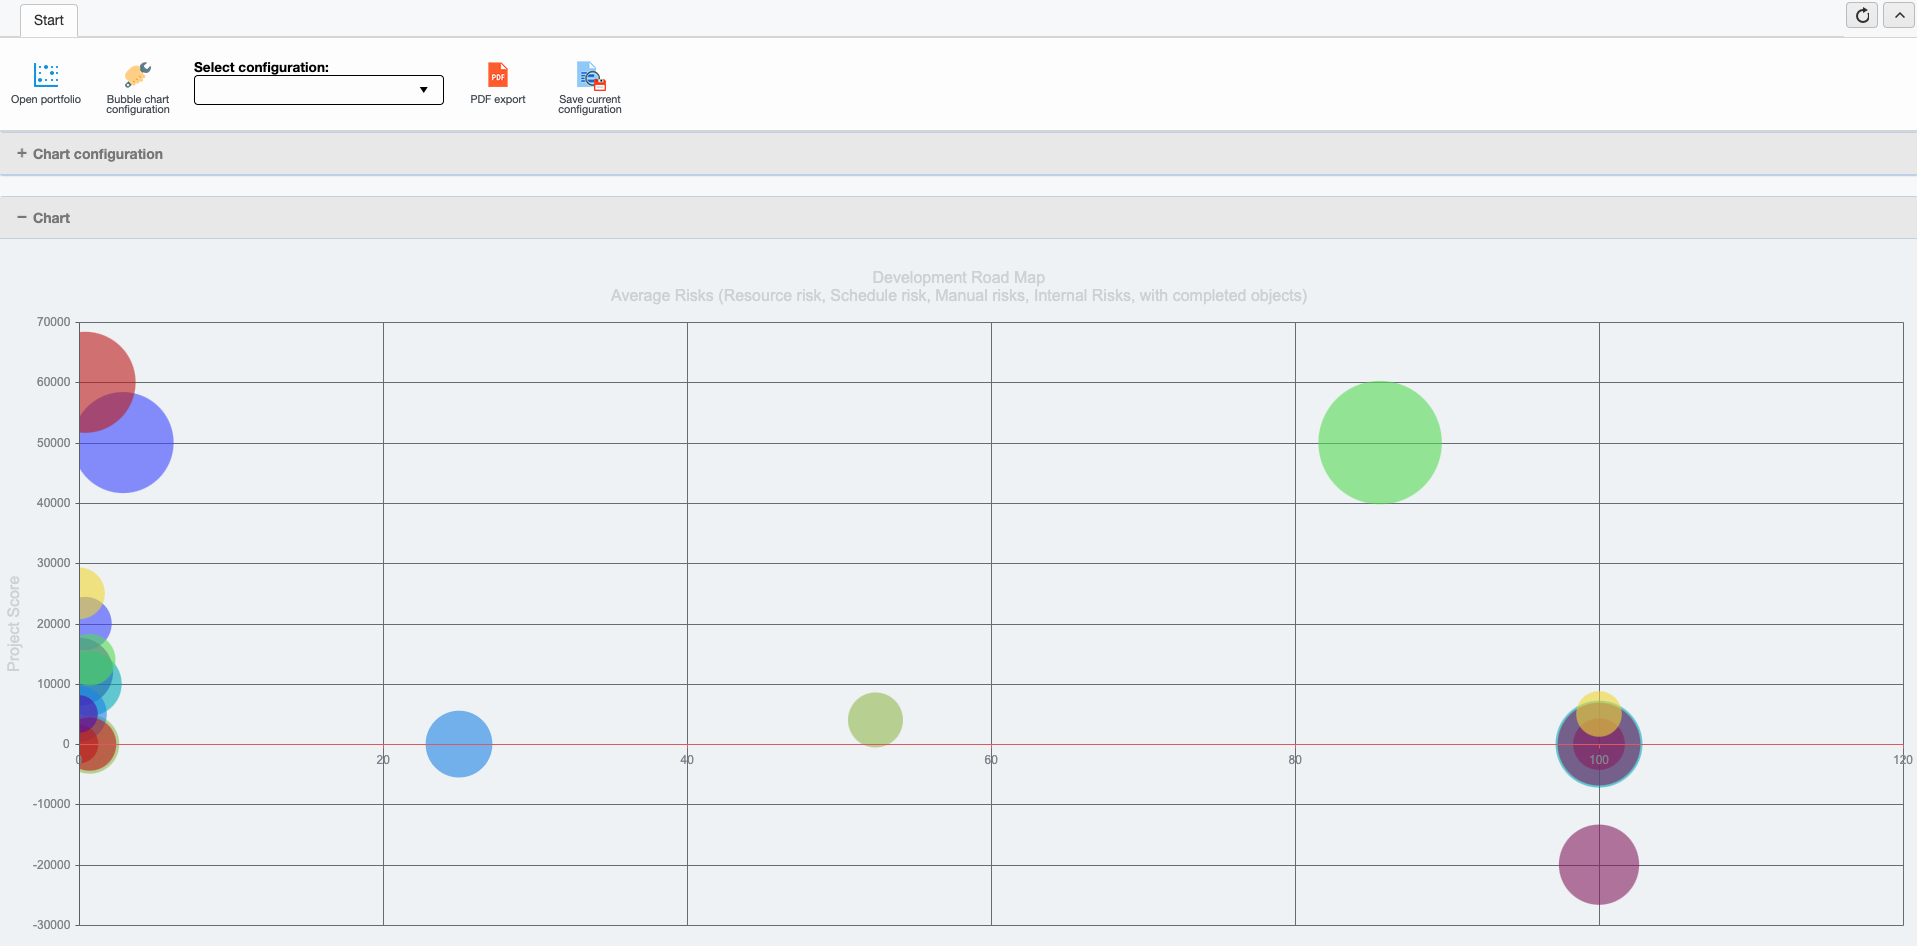
The bubble chart provides a multi-dimensional view of the projects in your portfolio. The bubble chart can be configured to compare projects according to different criteria.
By default, the average risks and project benefits are used as values for the x and y axes. The third dimension, the size of the bubbles (radius), represents the planned effort in the project.

Other metrics can also be used for all three dimensions. The metrics can either be selected dynamically using the "Chart configuration" menu item, or different configuration profiles can be defined and saved for regular use using the "Bubble chart configuration" button.

First define the configuration name (e.g. Board of Directors). Then select the desired measure (parameter) for each dimension from the appropriate category. Depending on the type of measure, you may also need to define the Sub-parameters (e.g. for risks) or Accuracy (e.g. for assigned effort) fields. Save your configuration profile afterwards.
You can find all the configured bubble chart views in the Portfolio Manager application.

![2020Logo_CanDo.png]](https://wissen.can-do.de/hs-fs/hubfs/2020Logo_CanDo.png?height=50&name=2020Logo_CanDo.png)